Example
The figure below presents the Sabine sound absorption coefficients in third octave bands for a 40-mm thick rock wool. Measurement were performed by Mickael Duranteau in 2006 [Dur06] at ENTPE (two vertical red lines are reported at frequencies 200 Hz and 2 500 Hz to identified absorption values considered to compute the SAA).
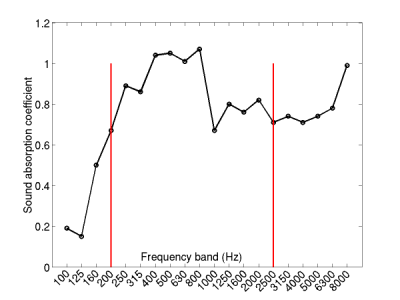
The measured sound absorption coefficient $\alpha_{i}$ per 1/3 octave band are reported in the table below.
| 1/3 octave freq. | Absorption measured |
|---|---|
| 100 | 0.19 |
| 125 | 0.15 |
| 160 | 0.50 |
| 200 | 0.67 |
| 250 | 0.89 |
| 315 | 0.86 |
| 400 | 1.04 |
| 500 | 1.05 |
| 630 | 1.01 |
| 800 | 1.07 |
| 1 000 | 0.67 |
| 1 250 | 0.80 |
| 1 600 | 0.76 |
| 2 000 | 0.82 |
| 2 500 | 0.71 |
| 3 150 | 0.74 |
| 4 000 | 0.71 |
| 5 000 | 0.74 |
| 6 300 | 0.78 |
| 8 000 | 0.99 |
From the measurement values above, the SAA is found to be equal to 0.86.
Comments
The Sound Absorption Average should be used with care:
- The frequency range used to compute the SAA is quite limited compared to the human hearing frequency area [20 - 20 000] Hz. In particular, the third octave bands around 4 000 Hz are not used in its computation.
- The third octave values used are equally weighted which does not correspond to the natural sensitivity of sound by a human ear.
Script
Follow the link compute_SAA.m to download a Matlab/GNU Octave script which compute the Sound Absorption Average from 1/3 octave band measurements.% Compute the Sound Absorption Average (SAA) % from absorption measurements in diffuse field. % % Measurements performed on a 40 mm-thick rock wool % by Mickael Duranteau during his 'DEUST VAS 2' % internship at ENTPE in 2006. % % Commands for the rotation of tick labels are % borrowed from rotateticklabel.m % Written Oct 14, 2005 by Andy Bliss % Copyleft 2005 by Andy Bliss % % Everything else is copyleft 2006 luc.jaouen@matelys.com % cf. APMR on the web, % Standards/SAA % for more information